Evaluating scenarios toward zero plastic pollution
Published on by Water Guardian Research in Technology
World will have 710M tons of plastic pollution by 2040 despite efforts to cut waste, study says
(CNN)If the world embarked on an immediate and globally-coordinated effort to reduce our plastic consumption, there would still be an estimated 710 million metric tons of plastic that will pollute the environment by 2040, new research has found.
The study, from a group of international researchers and published in the journal Science on Thursday, found that even in a "best-case scenario" where the amount of plastic pollution was reduced by 80% by 2040, there would still be a massive build-up of accumulated plastic.
"The biggest takeaway from our work is that if we don't do anything, the plastic pollution problem is going to become unmanageable. Doing nothing is not an option, said Dr. Winnie Lau, co-author of the study and senior manager for Pew's Preventing Ocean Plastics campaign.
Lau called their findings a "bad news, good news situation" because while the plastic pollution problem is set to get worse, we have all the knowledge, technology and tools to make a huge dent.
The team found that seriously ramped up global efforts could cut plastic pollution by 40% from 2016 levels, or 78% relative to a "business as usual" model by 2040.
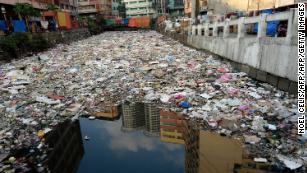
How rivers became the plastic highway into the oceans
Millions of tons of plastic enter the oceans every year, polluting the seas, littering beaches and endangering wildlife. Plastic particles have been found in soils, in the atmosphere and even in the most remote regions of Earth, such as Antarctica. Microplastics are also eaten by fish and other sea creatures, where they enter the food chain.
A rapid growth in plastic production, spurred by a rise in single-use plastics and a "throw-away" culture has exacerbated the problem, the report said. Meanwhile, waste management systems in countries around the world don't have the capacity to safely dispose of or recycle plastic waste.
Dr. James Palardy, co-author of the report and Director of Pew's Conservation Science Program, said the true cost plastic pollution has on human health and the environment -- and of doing nothing to reduce it -- is largely unknown, but waiting to find out how it affects us is not the answer.
"Do we really want to be guinea pigs for a global experiment?" he said.
To avoid a plastic pile up greater than the estimated 710 million metric tons (782 US tons) by 2040, the team said coordinated global action is needed. That means reducing plastic consumption, increasing the rates of reusing plastic, improving waste collection and recycling, and expanding safe disposal systems.
And everyone is needed to do their part.
"This isn't a problem for the developing world, this is a problem for everyone to solve," said Palardy.
SOURCE
Study abstract:
Plastic pollution is a pervasive and growing problem. To estimate the effectiveness of interventions to reduce plastic pollution, we modeled stocks and flows of municipal solid waste and four sources of microplastics through the global plastic system for five scenarios between 2016 and 2040. Implementing all feasible interventions reduced plastic pollution by 40% from 2016 rates and 78% relative to ‘business as usual’ in 2040. Even with immediate and concerted action, 710 million metric tons of plastic waste cumulatively entered aquatic and terrestrial ecosystems. To avoid a massive build-up of plastic in the environment, coordinated global action is urgently needed to reduce plastic consumption, increase rates of reuse, waste collection and recycling, expand safe disposal systems and accelerate innovation in the plastic value chain.
Plastic pollution is globally ubiquitous. It is found throughout the oceans, in lakes and rivers, in soils and sediments, in the atmosphere, and in animal biomass. This proliferation has been driven by rapid growth in plastic production and use combined with linear economic models that ignore the externalities of waste ( 1 , 2 ). A sharp rise in single-use plastic consumption and an expanding ‘throw-away’ culture ( 1 ) have exacerbated the problem. Waste management systems do not have sufficient capacity at the global level to safely dispose of or recycle waste plastic ( 3 , 4 ), resulting in an inevitable increase in plastic pollution into the environment. Previous studies estimated approximately 8 million metric tons (Mt) of macroplastic ( 5 ) and 1.5 Mt of primary microplastic ( 6 ) enter the ocean annually. Comparable estimates for terrestrial plastic pollution have yet to be quantified. If plastic production and waste generation continue to grow at current rates, the annual mass of mismanaged waste has been projected to more than double by 2050 ( 1 , 2 ) and the cumulative mass of ocean plastic could increase by an order of magnitude from 2010 levels by 2025 ( 5 ). Despite the magnitude of these flows, the efficacy and economic costs of solutions proposed to solve the plastic waste problem – the uncontrolled release of plastic waste into the environment resulting from ineffective management – remains unknown.
A growing body of evidence points to a broad range of detrimental effects of plastic pollution. Nearly 700 marine species and over 50 freshwater species are known to have ingested or become entangled in macroplastic ( 7 , 8 ) and there is growing evidence that plastic is ingested by a wide range of terrestrial organisms ( 9 ). Plastic pollution impacts many aspects of human well-being: affecting the aesthetics of beaches ( 10 ), blocking drainage and wastewater engineering systems ( 11 ) and providing a breeding ground for disease vectors ( 10 , 12 ). The lower-bound estimate of the economic costs of plastic pollution on fishing, tourism and shipping have been estimated at USD 13 billion annually ( 13 ). Although harmful effects of microplastic (here defined as plastics < 5 mm) have not been consistently demonstrated, ingestion has been documented across trophic levels and at all depths of the ocean in individual organisms and species assemblages ( 8 , 14 ) and in terrestrial organisms ( 15 ). Microplastics are also increasingly found in the human food system though their impacts on human health are difficult to assert and require further research ( 16 , 17 ). Plastic production, collection and disposal are also major sources of greenhouse gas (GHG) emissions ( 18 ).
Cost-effective solutions to managing plastic waste vary considerably across geographies and social settings ( 3 ), and a variety of solutions to the plastic pollution problem have been proposed at local, national and regional levels ( 19 , 20 ). Some proposed interventions focus on post-consumption management, requiring considerable growth in investment and capacity of waste management solutions ( 21 , 22 ). Other interventions prioritize reducing plastic through replacement with alternative products, reuse, and the development of new delivery models ( 23 ). Individual countries have established bans or levies on select plastic products, with a particular focus on banning single-use carrier bags and microbeads in cosmetic products ( 24 , 25 ). The European Union recently adopted a directive on single-use plastics ( 26 ) while the Basel Convention was amended to regulate the international trade of plastic waste ( 27 ). The scientific community and non-governmental organizations are also working to identify solutions ( 21 , 28 ). Despite these efforts, a global evidence-based strategy that includes practical and measurable interventions aimed at reducing plastic pollution does not yet exist.
Modeling approach
Designing an effective global strategy requires an understanding of the mitigation potential of different solutions and the magnitude of global effort needed to appreciably reduce plastic pollution. To estimate mitigation potential under different intervention scenarios, we developed the Plastics-to-Ocean (P2O) model. P2O is a data-driven coupled ordinary differential equation (ODE) model that calculates the flow of plastics through representative systems. We used the model to characterize key stocks and flows for land-based sources of plastic pollution across the entire value chain for municipal solid waste (MSW) macroplastics (figs. S1 and S2) and four sources of primary microplastics (i.e., those entering the environment as microplastics) [supplementary materials (SM) section 15 and figs. S3 to S6). Crucially, it provides estimates of plastic waste input into the environment. Costs are calculated as a function of modeled plastic flows, and changes in costs due to production scale and technological advancement are accounted for through learning curves and returns to scale (SM section 16.1).
Projected growth in demand for plastic was calculated using country-level population size ( 29 ), per capita macroplastic MSW ( 30 , 31 ) and microplastic-generating product use and loss rates. Per capita waste generation and waste management processes (e.g., collection costs, collection and processing rates, recycling recovery value) and rates of primary microplastic generation vary by geography and plastic category/source ( 6 , 32 – 34 ). To account for these differences, the global population was split across eight geographic archetypes based on World Bank income categories (low income, lower- and upper- middle income and high income); and United Nations urban-rural classifications ( 29 ). Populations were further differentiated by their distance to water ( < 1 km or > 1 km) to estimate their relative flows of plastic pollution to terrestrial versus aquatic (lakes, rivers and marine environments) systems. To account for different waste management pathways ( 35 ) and movement rates of waste in the environment ( 35 ), MSW plastics were differentiated into three material categories: rigid monomaterial, flexible monomaterial and multi-material/multi-layer. Four microplastic sources were modeled: synthetic textiles, tires, plastic pellets and personal care products.
Five scenarios were developed to estimate reductions in plastic pollution over the period 2016-2040. Scenarios were defined by four high-level classes of interventions (reduce, substitute, recycle, dispose) and eight system interventions: (i) reducing plastic quantity in the system, (ii) substituting plastics with alternative materials and delivery systems, (iii) implementing design for recycling, (iv) increasing collection capacity, (v) scaling-up sorting and mechanical recycling capacity, (vi) scaling-up chemical conversion capacity, (vii) reducing post-collection environmental leakage, and (viii) reducing trade in plastic waste (table S7). Scenarios modeled include: (i) ‘Business as Usual’ (BAU), (ii) ‘Collect and Dispose’, (iii) ‘Recycling’, (iv) ‘Reduce and Substitute’, and (v) an integrated ‘System Change’ scenario that implemented the entire suite of interventions (tables S8 and S57).
At all relevant geographical scales, waste production and handling data are notoriously difficult to obtain. Many model inputs have a high degree of uncertainty which was propagated using Monte Carlo sampling. Data inputs and assigned uncertainties are described in supplemental material (SM section 5.6). In the absence of datasets with which to formally validate the model, sensitivity analyses were conducted to quantify the influence of individual model inputs and to identify key drivers of plastic pollution. Model outputs from the BAU scenario were also compared against results from other global studies ( 2 , 5 , 36 ).
Business as usual
The BAU scenario highlights the scale of the plastic pollution problem and provides a baseline from which to compare alternative intervention strategies (Fig. 1). At a global scale from 2016-2040, the annual rate of macro- and microplastic entering aquatic systems from land increased 2.6-fold (Fig. 1C and Table 1). Over the same period, the rate of plastic pollution retained in terrestrial systems increased 2.8-fold (Fig. 1D and Table 1).

Fig. 1 Annual rates of plastic pollution entering the environment estimated from 300 Monte Carlo simulations.
( A ) Time series of plastic pollution entering aquatic and terrestrial ecosystems (Mt/y ± 95% CI) by scenario, 2016 – 2040. Scenarios: ‘Business as Usual’ (BAU), ‘Collect and Dispose” scenario (CDS), ‘Recycling’ scenario (RES), ‘Reduce and Substitute’ scenario (RSS), and ‘System Change’ scenario (SCS). Plastic pollution rates for all scenarios between 2016 and 2020 are identical. The black point estimate in 2040 represents the annual rate of plastic pollution assuming global commitments to reduce plastic use and increase recycling announced before June 2019 are implemented prior to 2040. A time series for this scenario is not presented because timelines for implementation are unknown. ( B ) Kernel density estimates for plastic pollution (Mt) in 2040 by scenario. Boxplots of plastic pollution entering ( C ) aquatic and ( D ) terrestrial ecosystems by scenario for beginning, middle, and end years of scenario implementation.
Table 1 Plastic mass; percent of total plastic demand under different end of life fates for year 2016 and for year 2040 under the ‘Business as Usual’ (BAU) and ‘System Change’ scenarios (SCS); and percent change in plastic mass under different end of life fates for SCS in 2040 relative to 2016 and BAU in 2040.
When current commitments to reducing plastic pollution were modeled assuming full implementation (SM section 9.1), annual plastic pollution rates into aquatic and terrestrial environments decreased by only 6.6% [95% Confidence Interval: 5.4, 7.9] ( 37 ) and 7.7% [5.2, 10] by 2040, respectively (Fig. 1A). This result confirms that current commitments coupled with appropriate policies can reduce plastic waste input into the environment but also shows that considerable additional effort will be needed to match the unprecedented scale of projected environmental plastic pollution.
Taxonomy
- plastic pollution
- plastic debris